
Fire and Rain
August Cold Front … In Texas?
I have called the new Texas weather patterns predictable, that is predictably unpredictable. We’re not talking the old saying, “If you don’t like the weather in Texas, wait a minute …” unpredictable. We’re talking fire and rain unpredictable.
And now that I have lobbed the first round, more like a slow moving black powder ball, we have further evidence of this pattern coming to Texas RIGHT NOW. Record breaking COOL temperatures are on the board for the rest of August. What August does this remind you of? my answer is NONE, no August in my lifetime of awareness has been like this.
Of course September will come, as will October, and with these months – who knows what we will see in the weather patterns. Earlier in the year, I ran an article on La Niña, and the predicted La Niña for winter 2025-26.
I am a pretty simple fly fisher. Either they (my finned friends) are there, or they’re not. Once I find fish, the next level thinking kicks in. Simplifying massively; either they’re biting or they’re not. So it is no surprise my thinking on climate change is also pretty simple.
It’s either raining like a bitch, or burning like hell nowadays. We haven’t seen the nuances of twenty years ago for several seasons. And a few seasons of rinse and repeat springs, and burning in hell summers? This forms what fly fishers call PATTERNS.
FOR EXAMPLE: From the Conejos River, I hear in FIRST PERSON that there is virtually no water and extreme drought below the reservoir. Now, did you hear that anywhere? Probably not. That is part of the problem, the elephant I talk about. If you pull up after a twelve hour drive, and see rocks? What are you going to do? Now that you know before you go, maybe you will check in with a guide, or your guide there on the Conejos. What will they say this week? What won’t they tell you? CHECK THE CONEJOS below PLATORO FLOWS HERE. The data line ends, strangely, in January 2025.
IF they tell you the truth, the difficulty of the conditions, they and ANY GUDE risks livelihood, food on the family table, or whiskey in the flask. If any Chamber of Commerce was to tell the truth? They would be looking for new jobs the next day. Even the LOOP video I mentioned yesterday, a video that spent a great amount of time on the environment, could dedicate hours and hours to the environmental conditions we are facing NOW.
So, I turn to ChatGPT. I fed it some prompts, flawed by asking for annual averages, but the point is plain to see in the graphics. The rain and temperature averages are flopping around “like a hooker on meth” as one of my favorite songwriters wrote.
For humans? These average numbers are tiny variations. But when we are talking nature, bugs and fish, fish that can sense barometric pressure? What do you think these numbers can do to the hardy, but fragile Texas flora and fauna? Look around your house. How’s your yard doing? How is your local reservoir doing, as the water levels rocket for a month in spring, and plummet through the summer and into fall, and even into winter some years?
Let’s Chat, Shall We?
THESE FACTS ARE FROM CHATgpt
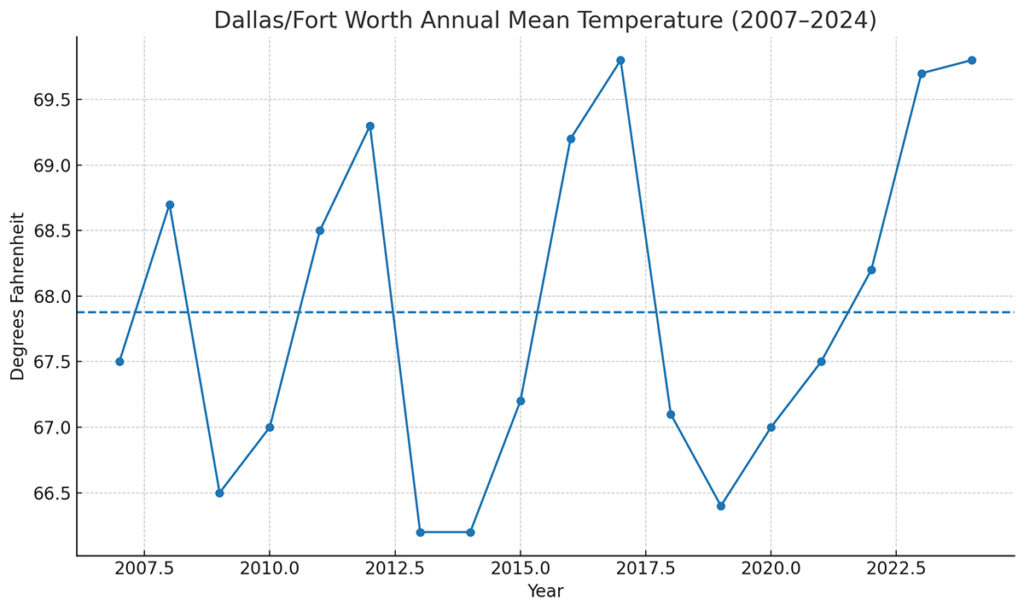
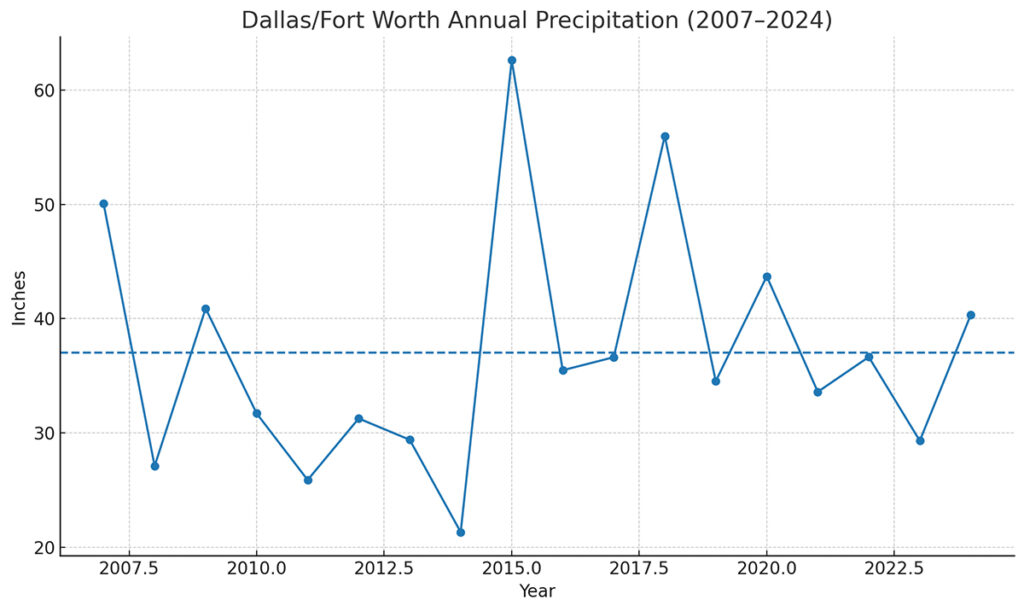
Here’s a clean, 18-year look (2007–2024) using official NWS/NOAA data for Dallas–Fort Worth (as the population anchor for North Central Texas). I’ve included a table, two quick charts, and a CSV you can grab.
Dallas–Fort Worth (DFW) — 2007–2024
- Avg annual rainfall: 37.0 inches
- Avg annual mean temperature: 67.9 °F
- Wettest year: 2015 — 62.61″
- Driest year: 2014 — 21.32″
- Hottest years (tie): 2017 & 2024 — 69.8 °F
- Coolest year (tie for low): 2013 & 2014 — 66.2 °F
(Sources: NWS Fort Worth DFW precipitation-by-year table and average-temperature-by-year table; DFW normals page for 30-yr mean reference. (National Weather Service))
What this says about North Central Texas (region-wide):
- The 18-year window features very large precipitation swings driven by drought (e.g., 2011) and flood years (2015, 2018). That pattern is typical across the North Central Texas region—with a general tendency for wetter totals east of I-35 and drier totals toward the west, but DFW is a solid regional proxy for year-to-year ups/downs. (National Weather Service)
- The multi-year warmth since ~2016 shows up clearly at DFW (several years at or above ~69 °F), even though a short 18-year linear trend can wobble due to a few cool years early in the period. For baseline context, the 1991–2020 normal annual mean at DFW is ~66.6 °F, so the last 18 years averaged about +1.3 °F warmer than that long-term normal. (National Weather Service)
Paying Attention
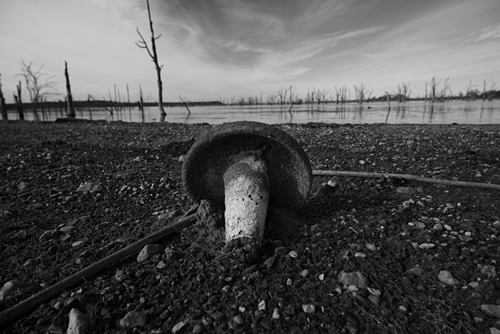
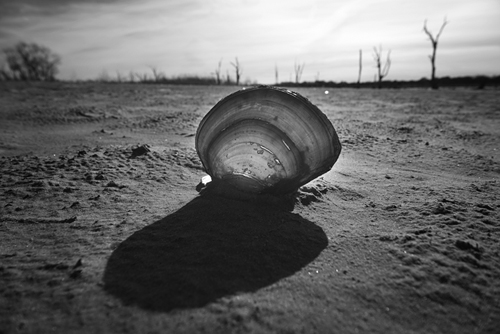
I have been bringing – ground level, head below the foxhole dirt – attention to the local fly fishing climate change for quite some time now. In the drought, I wandered the flats that were high-and-dry … finding strange things to photograph, and even did some video recording to illustrate where the water once was. But, at the time … at that time, I only saw it as an aberration NOT A PATTERN. But, there was a pattern forming, one that most of us were unaware of.
How Environmental Patterns Sneak Up
This could be “boomer” to say, but time has a way of happening faster as you age. In other words, years and seasons compress together. When they get closer together, it’s easier to see the patterns. We all agree, “getting old sucks,” but it has a few advantages. And one of them is “perspective.” If you have read this far, let me tell you – you’ll understand if you don’t already. And that perspective can also show us – MAYBE I SHOULD HAVE STARTED down this road sooner than now. But this is happening now, and like I said, I don’t have a dog in the race when it comes to WHY IT IS HAPPENING. That is up to you, the fly fisher, to determine. It is too late for me to pick up the cause. It’s on you, the YOUNG FLY FISHERS to bring about change to this slow burn.
In the next “Fire and Rain” story, I will tell you a local fly fishing environmental story that is hardcore evidence of what temperature change has done to HURT to our LOCAL FLY FISHING SCENE, and all of our abilities to live a happier life outdoors – in Denton County Texas.